




“Gold delivered 38.23% in the last one year, while Small Cap Funds delivered only 10.68%.”
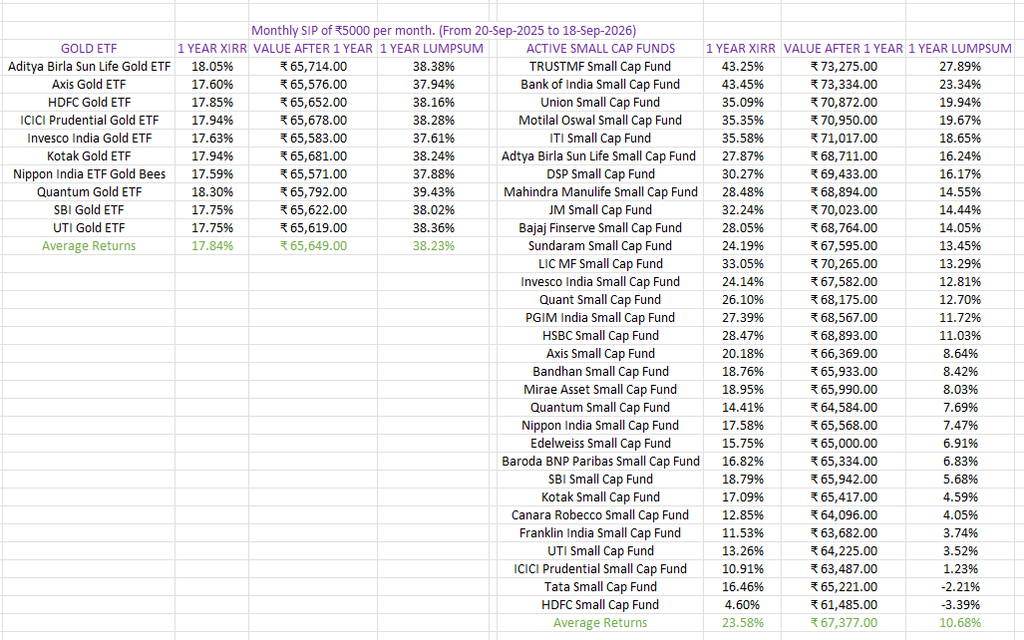
If you looked at these numbers, what would you think?
Most of us would probably say:
“Gold clearly outperformed Small Cap.”
But wait.
There is another side to the same data.
When we look at the SIP returns for the same period, the picture changes completely:
🟡 Gold ETF SIP XIRR: 17.84%
🟢 Small Cap Fund SIP XIRR: 23.58%
That’s roughly 32% higher for Small Cap SIPs compared with Gold SIPs.
Now the obvious question is:
How can this happen?
The answer is simple:
The timing of your investment matters.
Lump Sum and SIP Are Not the Same
Imagine you have ₹60,000 to invest.
If you invest the entire ₹60,000 on the first day, your entire money participates in the market from day one.
That’s a lump-sum investment.
But with a SIP, you invest a fixed amount every month.
Your first instalment gets more time in the market.
Your second instalment gets slightly less.
The latest instalment gets very little time.
So every SIP instalment experiences a different market price and a different market journey.
That’s why the return of a lump-sum investment can be very different from the return experienced by a SIP investor.
So, What Happened With Gold?
Gold had a very strong run during the period shown in the data.
The average 1-year lump-sum return for Gold ETFs was 38.23%.
Sounds impressive, right?
But here’s the catch.
If you were investing through a monthly SIP, you weren’t putting your entire money into Gold at the beginning of that rally.
You were investing gradually.
Some of your SIP instalments went in after Gold had already moved up significantly.
As a result:
Gold Lump Sum: 38.23%
Gold SIP XIRR: 17.84%
Quite a difference.
Now Look at Small Cap Funds
This is where the comparison becomes interesting.
The average 1-year lump-sum return for the Small Cap Funds shown was 10.68%.
At first glance, Gold looks like the obvious winner.
But the average XIRR for Small Cap SIPs was 23.58%.
Why?
Because the market did not move in a straight line.
Small Cap investors were investing at different points during the year. When prices were lower, their SIP instalments purchased more units.
When the Small Cap segment recovered, those accumulated units benefited from the recovery.
So the experience of the SIP investor was very different from someone who had invested the entire amount at the beginning.
This Is Why XIRR Matters for SIP Investors
When you invest through SIP, you are making multiple investments on different dates.
That’s why looking only at the fund’s headline return can sometimes give you the wrong impression.
XIRR considers the timing of your cash flows and gives you an annualised measure of what your investment actually earned.
Think of it this way:
Lump Sum Return
“What happened to money invested at one point in time?”
SIP XIRR
“What did my money earn when I invested it gradually?”
For a regular SIP investor, the second question is extremely important.
Don’t Chase Yesterday’s Returns
This is perhaps the biggest lesson from the comparison.
Suppose you see:
Gold: +38.23%
You may immediately think:
“I should have invested in Gold.”
But if you’re a SIP investor, that’s not necessarily the return you would have experienced.
Similarly, seeing Small Cap Funds at only 10.68% lump-sum return might make you think Small Cap had a poor year.
But the SIP investor’s average XIRR was 23.58%.
Same market. Same period. Very different investment experience.
That’s why blindly chasing the highest 1-year return can be misleading.
Does This Mean Small Cap Is Better Than Gold?
No.
That’s not the conclusion we should draw.
This comparison simply shows what happened during one particular period.
Gold and Small Cap Funds are completely different investments.
Gold can play a diversification role in a portfolio.
Small Cap Funds invest in smaller companies and can experience significantly higher volatility.
So the right question isn’t:
“Which one gave higher returns last year?”
A better question is:
“Which investment is suitable for my financial goals, time horizon and risk profile?”
The Real Lesson for SIP Investors
Your investment return isn’t determined only by what you invest in.
It is also influenced by when your money enters the market.
That’s one of the reasons SIPs can produce a very different outcome from lump-sum investing.
So the next time you see a headline saying:
“This asset class delivered 30% last year!”
don’t immediately assume that your SIP would have earned 30%.
Ask:
“What did a SIP investor actually earn?”
That’s the number that may be much more relevant to you.
The Bottom Line
The comparison gives us a very interesting lesson:
Gold
➡️ Average Lump Sum Return: 38.23%
➡️ Average SIP XIRR: 17.84%
Small Cap Funds
➡️ Average Lump Sum Return: 10.68%
➡️ Average SIP XIRR: 23.58%
The numbers tell us something important:
Headline returns don’t always tell the complete story for a SIP investor.
So, before chasing yesterday’s best-performing investment, understand how the return was generated and how your own money was actually invested.
Don’t chase yesterday’s returns. Start building tomorrow’s wealth.
Disclaimer: The figures discussed are based on the attached comparison for the specified period. Past performance is not indicative of future returns. SIPs do not guarantee returns or eliminate investment risk. Mutual Fund Investments are subject to market risks. Read all scheme-related documents carefully before investing.